I can see the finish line for this semester from here which means thats it’s time for my last update on my DA prior to submission. (If you want a tldr, here’s a link to my Beta)
Now that we are reaching the end, my DA has mainly been a process of consistency and perseverance.


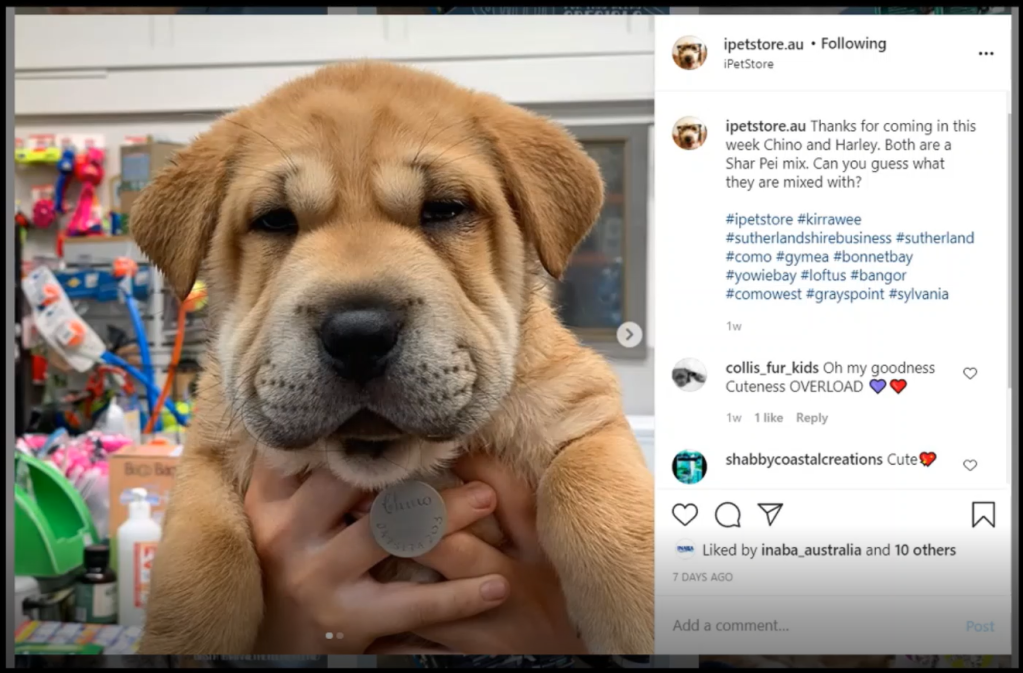
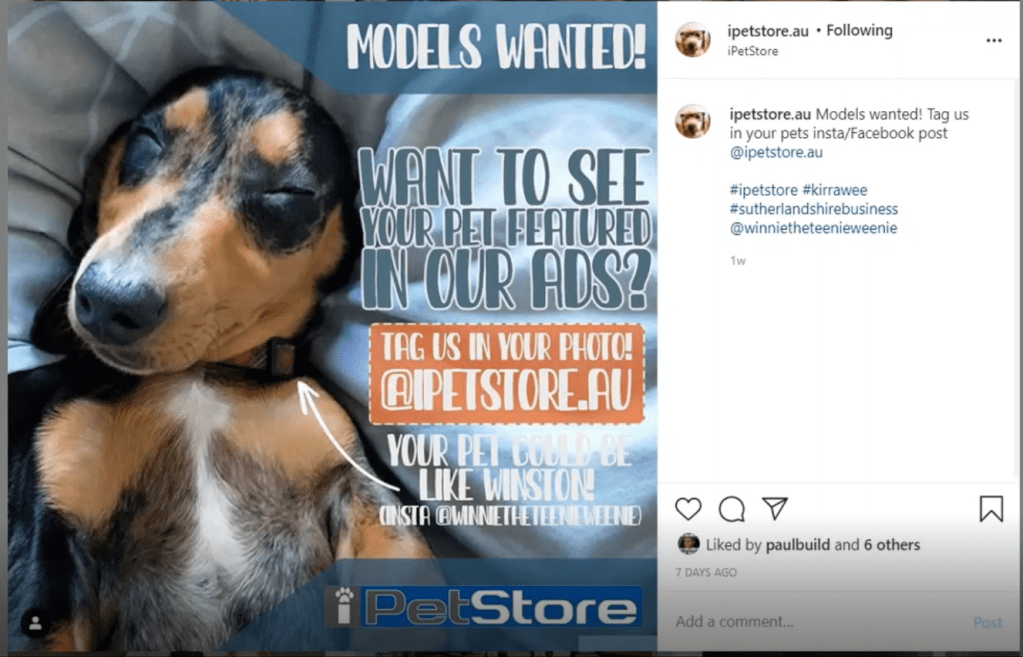
We have actually had a large amount of succes with more locals coming into our warehouse telling us that they had found out about our existence through Facebook and/or Instagram, which is exactly what we’ve wanted to hear.
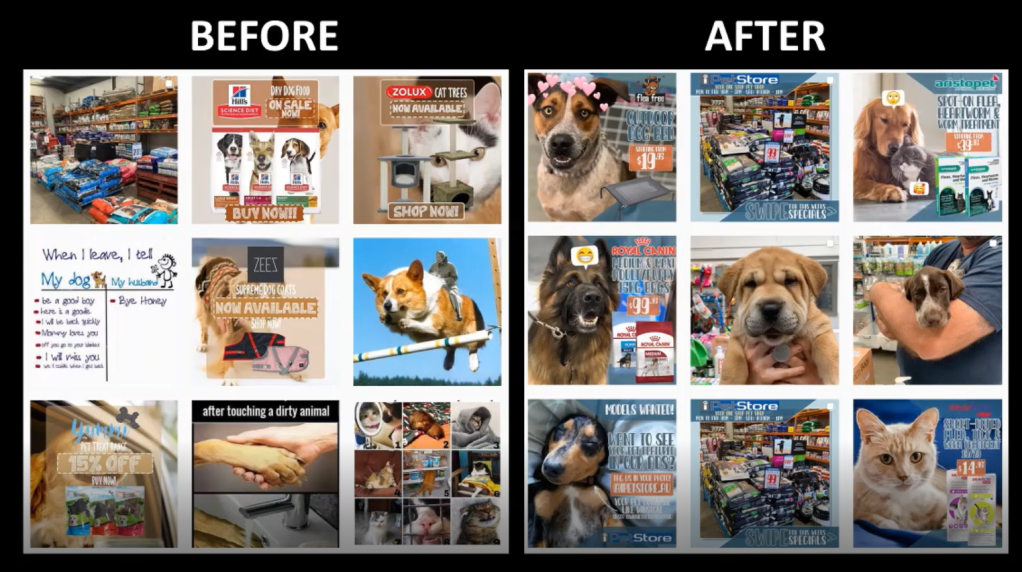
Prior to now, we hadn’t had much focus on our social medias in terms of promotional materials, favouring outdated avenues such as email. This means there was a lot of room for improvement in terms of visuals and aesthetic which you will see throughout the Beta video above. Along with the video, I will be posting side-by-sides of the data I’ve collected from my research regarding our Instagram interactions from the first half of this year next to our current interactions within the second half of 2020. This will hopefully show how the changes we have made are already altering our statistics:
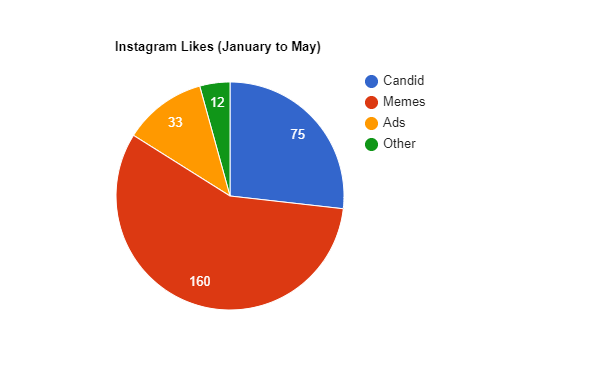
I have arranged these stats into easier to read graphs for convenience (and so you all don’t have to read my terrible hand writing. These are the amount of likes and comments we had received in the first half of this year, divided into different post styles:
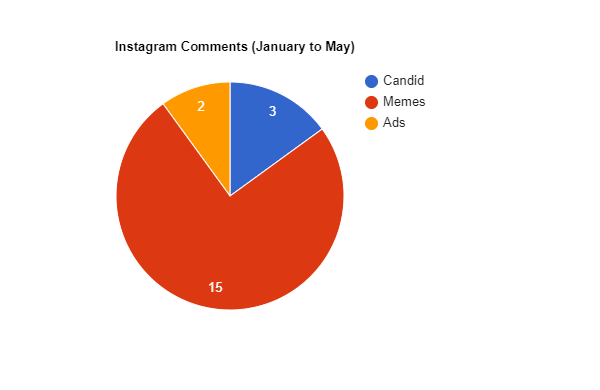
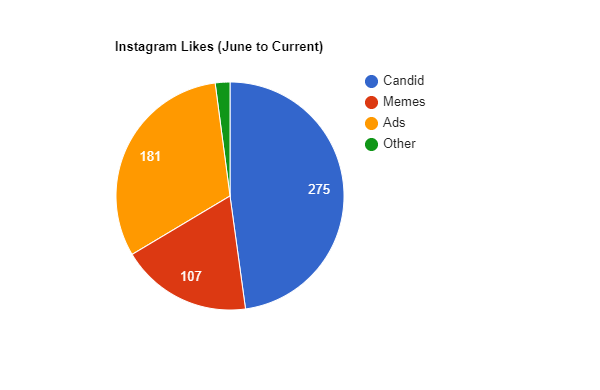
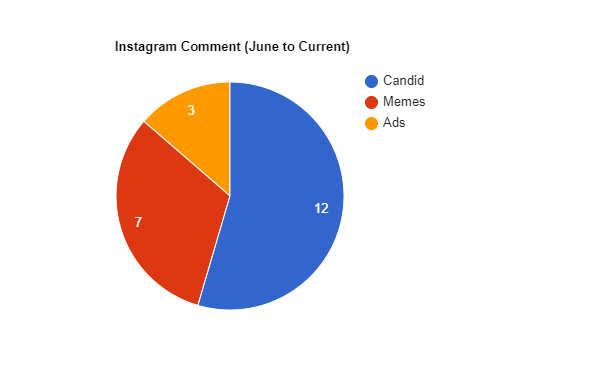
And these show how many likes and comments we have recieved since June:
These are the overall and average stats for the first half of this year:
Total Posts: 40
Total Likes: 290
Total Comments: 20
Memes
Posts: 22
Total Likes: 160
Total Comments: 15
Average Likes P/P (Per Post): 7.27
Average Comments P/P: 0.68
Candid
Posts: 5
Total Likes: 75
Total Comments: 3
Average Likes P/P: 15
Average Comments P/P: 0.6
Ads
Posts: 11
Total Likes: 33
Total Comments: 2
Average Likes P/P: 3
Average Comments: 0.18
Other
Posts: 2
Total Likes: 12
Total Comments: 0
Average Likes P/P: 6
Average Comments P/P: 0
And these are the overall/average stats from June to Now:
Total Posts: 81
Total Likes: 545
Total Comments: 22
Memes
Posts: 20
Total Likes: 107
Total Comments: 7
Average Likes P/P (Per Post): 5.35
Average Comments P/P: 0.35
Candid
Posts: 23
Total Likes: 275
Total Comments: 12
Average Likes P/P: 11.96
Average Comments P/P: 0.52
Ads
Posts: 35
Total Likes: 181
Total Comments: 3
Average Likes P/P: 5.17
Average Comments: 0.08
Other
Posts: 2
Total Likes: 12
Total Comments: 0
Average Likes P/P: 6
Average Comments P/P: 0
It is interesting to see the rapid difference already with over double the amount of posts, meaning double the amount of likes.
We are currently working on breaking down our initial posts into base elements to be able to rebuild them into newer kinds of content that we may be able to use as replacements for memes considering they have not been working well within these new formats. We are currently developing prototypes for product reviews and flatlay imagery to try and spice up the feed even more.
It’ll be interesting to see the final results in the next couple of weeks but until then, that’s all from me. If you’re interested in keeping up to date with all my updates, stats and research, please go and follow me over on Twitter (@drawoncedraw) where I have been (trying very hard) posting updates each week.
Thanks for reading!!
~Bree

Your prototyping phase is clear it’s very interesting how you have identified the audience interest through the statistics. I like the comparisons between the original ad layout and the new ad layout. Really good use of the editing to make to pets look adorable in the new layout.
LikeLike